History, Recorder, and data export
Home Assistant quietly records every light switched on, every unit of energy consumed, and every door opened. This chapter explains where that history is stored, how long it lasts, how to export it as CSV, and how to keep the database from filling your storage or wearing out a memory card.
Why this matters
Once your devices and automations are running, you will almost certainly encounter two situations:
First: You want to know who left the balcony light on all night last Wednesday, or how much energy the air conditioner used this month. Data from three days ago is available, but data from three months ago is gone—even though last year’s energy use is still visible. This is intentional, and this chapter explains why.
Second: Home Assistant becomes unusually slow: a light takes three seconds to respond, and a restart takes ten minutes. An oversized database is a common cause. On a Raspberry Pi that uses a microSD card, sustained database writes can also shorten the card’s life.
By the end of this chapter, you will be able to:
- Choose between History and Activity (formerly Logbook) for a given question.
- Identify where Recorder stores data, how long it retains detailed history by default, and what affects database size.
- Use
includeandexcludeto keep noisy entities out of Recorder. - Export CSV data for analysis in Excel or Google Sheets.
- Purge an oversized database, respond safely to corruption, and choose a long-term storage option.
Chapter 9 covers general backup practices; this chapter focuses on how the database affects backups. See entity_id conventions in Chapter 4 for entity naming used in the filtering examples.
History and Activity answer different questions
The sidebar contains two similar entries: History and Activity. They answer different questions.
logbook. Older instructions that mention Logbook refer to the same feature.| Question | Where to look | Why |
|---|---|---|
| “How did the living-room temperature change over the past three days?” | History | History plots numeric values as a line chart for trend analysis. |
| “How many hours was the entry light on yesterday?” | History | History shows switch entities as timelines, making their active periods easy to see. |
| “Who just turned off the air conditioner?” | Activity | Activity records the user or automation responsible. |
| “What happened at 3:00 a.m.?” | Activity | Activity lists events in reverse chronological order. |
| “Did this automation run?” | Activity | An automation trigger leaves an entry in Activity. |
In everyday terms, History is the chart in a medical record; Activity is the nursing shift log. The former shows how values changed, while the latter shows who or what performed an action.
One practical difference is that Activity omits sensors with units by default. Temperature, humidity, and power sensors can update every few seconds and would overwhelm the event list. View those sensors in History instead.
Recorder: the source of all history
History and Activity are views; they do not store data themselves. The Recorder integration writes state changes to storage.
You usually do not install Recorder separately. History relies on Recorder, and both use the same database settings. A new installation enables them through configuration.yaml with default_config:.
Which file stores the data?
By default, Home Assistant uses SQLite. Its database is a single file in the configuration directory:
/config/home-assistant_v2.dbThis single file contains the default Recorder database. Because it is stored beside configuration.yaml, a full backup normally includes it.
Default retention period
Recorder’s purge_keep_days setting defaults to 10 days. Detailed state changes older than that are deleted automatically.
Recorder also uses the following defaults:
| Option | Default value | Purpose |
|---|---|---|
purge_keep_days |
10 |
Number of days to retain detailed history. |
auto_purge |
true |
Delete expired data automatically at 04:12 local time each morning. |
auto_repack |
true |
Reorganize the database every second Sunday so freed space is returned to storage. |
commit_interval |
5 |
Number of seconds between writes of accumulated changes to the database. |
commit_interval batches changes in memory before writing them to storage. The default is 5 seconds. Increasing it, for example to 30, reduces writes but can lose up to that interval of data during a power failure.How big will the database be?
Database size depends on both the number of entities and how often they change. Use these examples only as rough guidance:
| Scenario | Approximate scale | Reasonable expectation |
|---|---|---|
| A few lights and temperature/humidity sensors | 20 to 50 entities | Usually tens of MB |
| A typical home with contact, occupancy, and appliance sensors | 100–300 entities | Hundreds of MB is common |
| Smart meter, solar, or second-by-second power monitoring | High-frequency numeric sensors | May reach several GB and grow quickly |
The key question is how many records each entity generates per day. A light may change 6 times, while a power sensor that reports every second can create tens of thousands of rows. One such sensor can generate more data than all other entities combined.
Use these two views to check current storage use:
| What you want to see | Where to go | What you will see |
|---|---|---|
| Free space on the system | Settings → System → Storage | Point to the usage bar to see remaining-space details. |
| Estimated database size | Settings → System → Repairs → three-dot menu → System information | Find Estimated database size under Recorder; the value is shown in MiB. |
The later SQL integration section shows how to expose database size as a sensor on your dashboard.
Long-term statistics: why energy lasts longer than switch history
Detailed history and long-term statistics have different retention rules.
Detailed history defaults to 10 days, yet the Energy dashboard can still show last year’s consumption. Home Assistant stores these as two different types of data.
| Short-term history (states) | Long-term statistics | |
|---|---|---|
| Stored data | Every state change | Hourly summaries |
| Resolution | Original timestamps and values | Hourly minimum, maximum, average, or change |
| Retention | 10 days by default | Not removed by the normal history purge |
| Eligible entities | All entities not excluded from Recorder | Only entities with a supported state class |
| Rows per day | Depends on update frequency; potentially tens of thousands | 24 hourly summaries |
The states table records individual changes. Statistics compress those changes into fixed-interval summaries, producing only 24 hourly rows per day and making multi-year retention practical.
Which entities have long-term statistics?
Only entities with a supported state_class enter the statistics table. Chapter 17 explains each state class; here the focus is retention:
| State class | What the statistics store | Household example |
|---|---|---|
measurement |
Hourly minimum, maximum, average | Living-room temperature, bedroom humidity, and current air-conditioner power |
total / total_increasing
|
Change during each period | Cumulative electricity or water-meter readings |
| No state class | No statistics; only the past 10 days of detailed history remain by default | Lights on/off, doors and windows open/closed, and home/away presence |
An energy meter with total_increasing retains long-term statistics, whereas a light’s nonnumeric on/off state has no state class and keeps only 10 days of detailed history by default.
This also explains why older History charts can look smoother and lose brief peaks. Within the detailed-history window, the chart uses full-resolution Recorder data; beyond it, the chart uses hourly long-term statistics. An hourly average will not exactly match any single reading. Home Assistant distinguishes the higher-resolution portion with a darker line.
purge_keep_days. Confirm that each entity has the correct state class and unit so Home Assistant can generate long-term statistics.Hands-on: Download history as CSV
Home Assistant can export History data to CSV without additional software.
-
Open History from the sidebar
If History is not visible, select your name at the bottom of the sidebar, open your profile, and check whether the item is hidden. Alternatively, append
/historyto the Home Assistant URL and press Enter. -
Select an area, device, or entity
Use the selector at the top to choose an area, device, or entity. Selecting an area shows the charts for its entities, provided that you assigned areas as described in Chapter 3.
-
Set the time range
Select Today, This week, or custom start and end dates. The selected range determines how many rows the CSV contains. Start with one day before requesting a large range.
-
Select Download data in the upper-right corner
The English interface labels the button Download data; localized interfaces use the corresponding translation. Selecting it saves a CSV file directly to your browser’s download folder without opening a settings dialog.
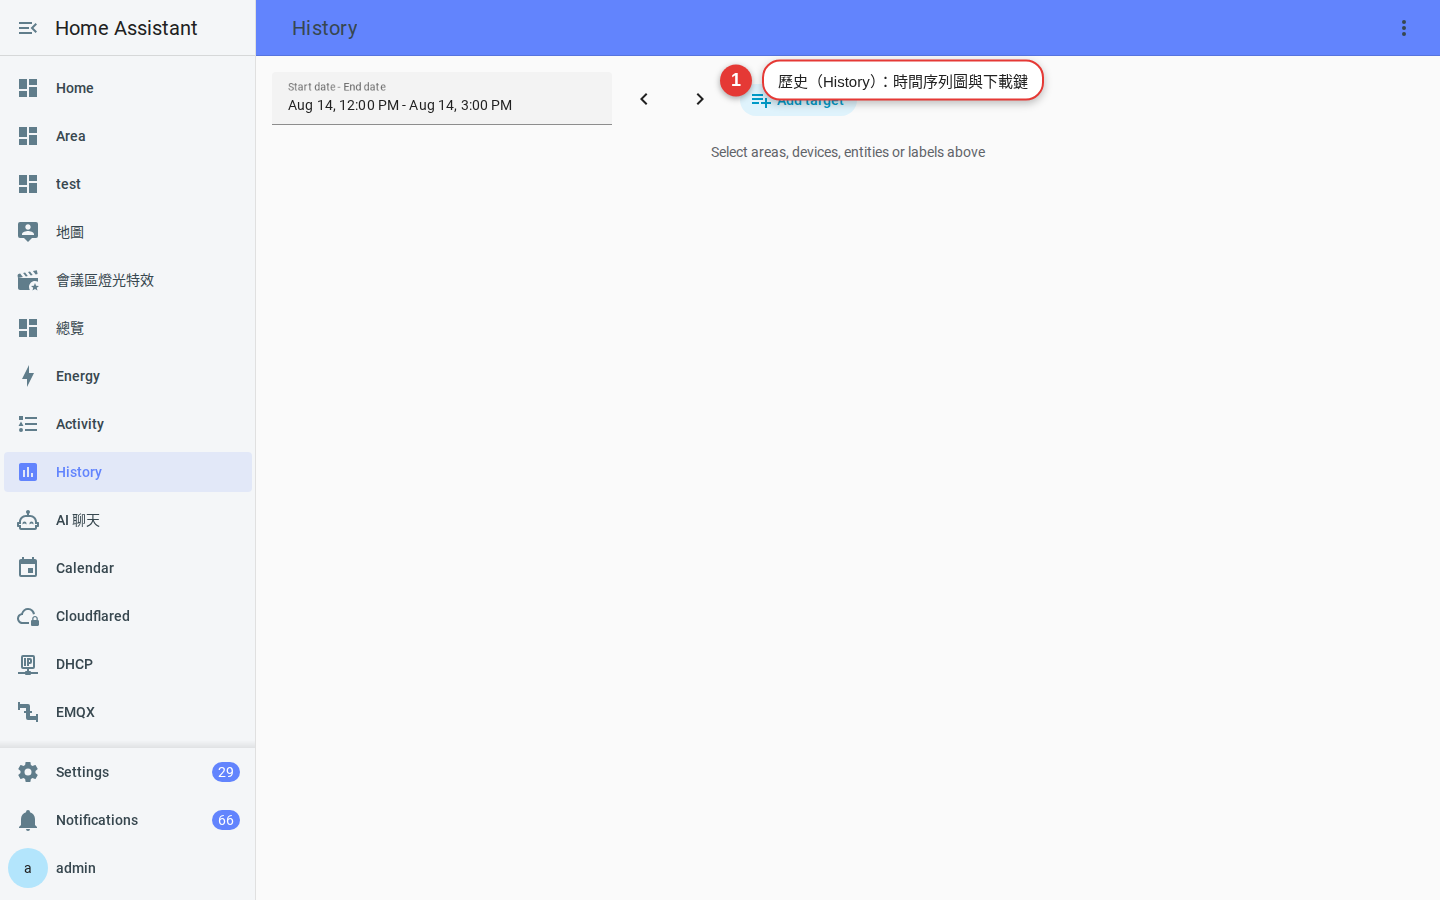
Figure 18-1 On the History page, use Add target on the left to add an area, device, or entity; Download data then appears in the upper-right corner. -
Open it in a spreadsheet
Open the file in Excel, Numbers, or Google Sheets. If non-Latin text is garbled, use the application’s import command and select UTF-8 instead of opening the file directly.
Export Activity events
Starting with Home Assistant 2026.8, Activity provides CSV download and a Clear and reset action. Choose the export that matches the data you need:
| Information needed | Where to download it | Result |
|---|---|---|
| Numeric trends such as temperature, energy, or humidity | Download data in the upper-right corner of History | Timestamps and values, suitable for charts |
| Event timeline: who acted and which automation ran | CSV download on the Activity page | Individual event records, suitable for investigations |
recorder.purge, described later in this chapter.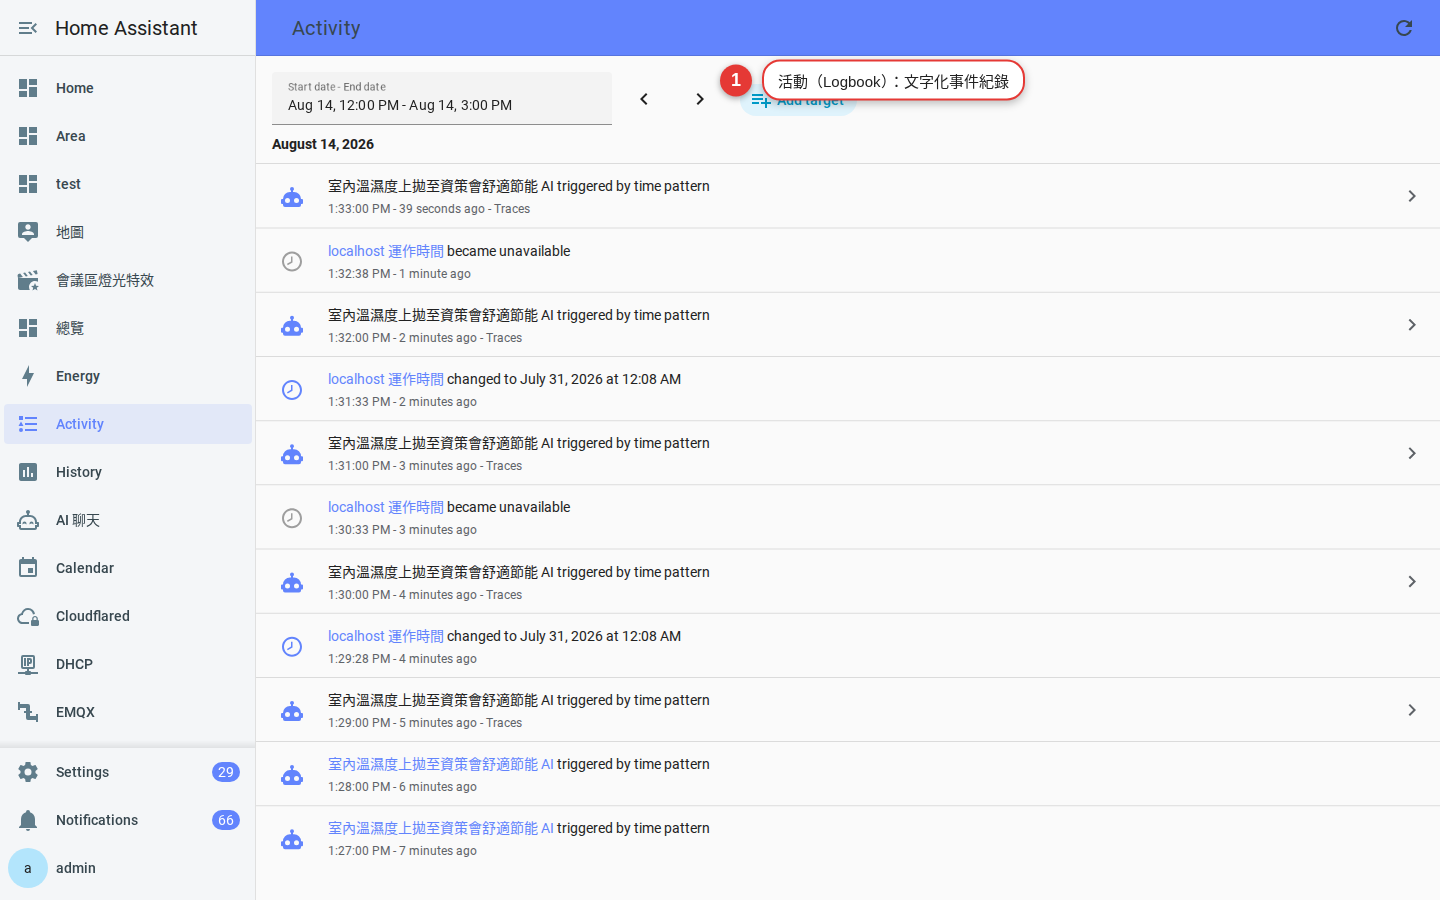
Tools → Statistics: Correct invalid values
Open Settings → Tools. Its tabs include YAML, States, Actions, Templates, Events, Statistics, and Assist.
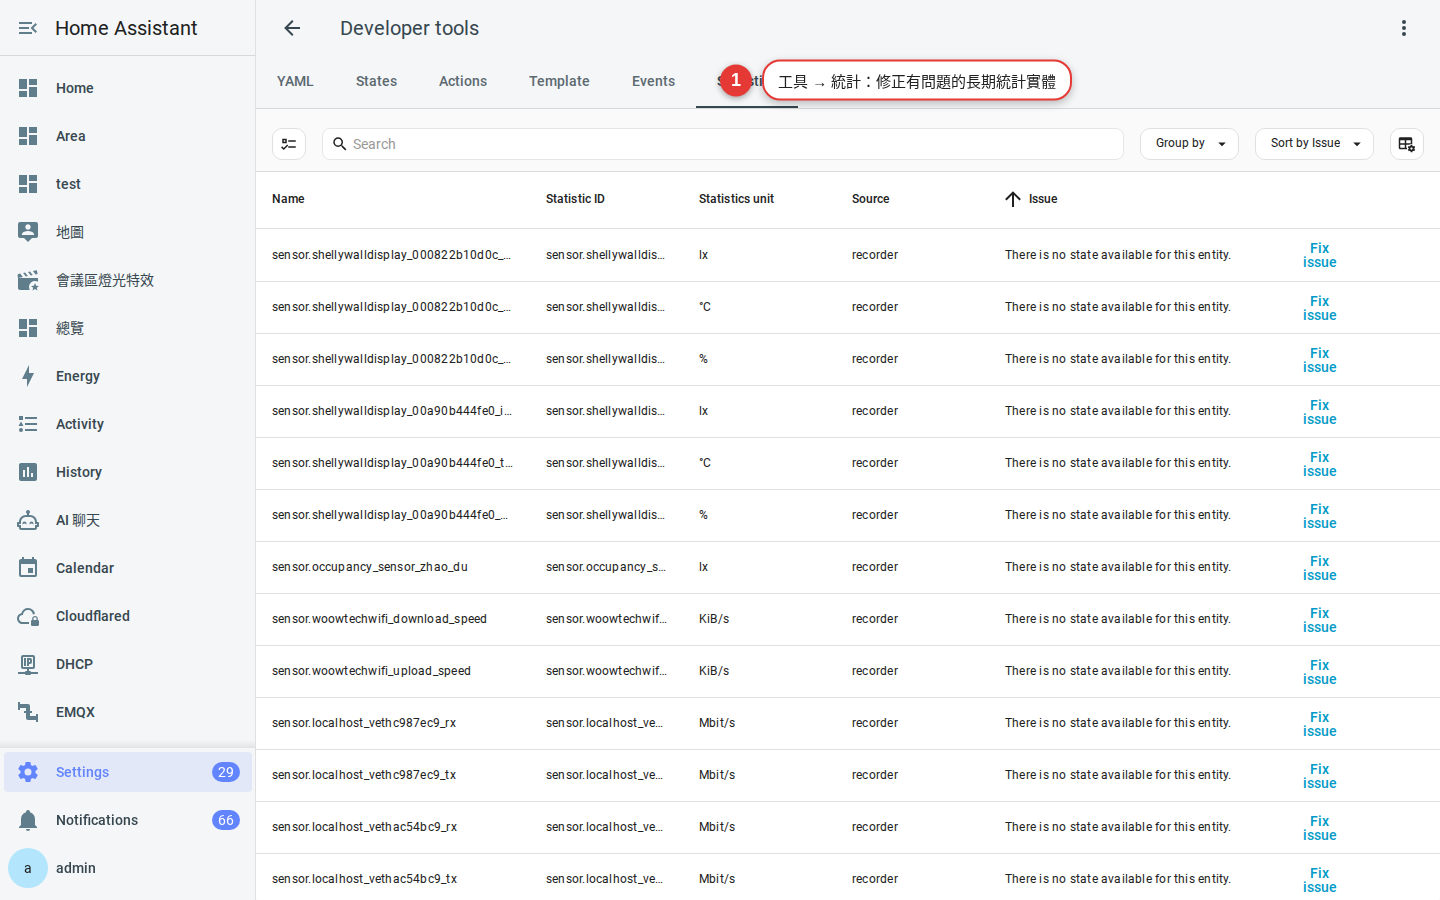
The Statistics page has two essential functions.
1. Identify entities with statistics problems
The page lists entities with long-term statistics. Affected entries have a Fix issue link that explains the detected problem. Common cases include:
| Issue | What it means | Typical response |
|---|---|---|
| Unit changed | The sensor previously reported W and now reports kW, making the existing statistics incompatible. | Follow the prompt to convert or retain compatible data, or clear the old statistics and start over. |
| State class no longer supports statistics | After an integration update, the entity no longer generates statistics. | Follow the prompt to remove obsolete statistics if you no longer need them. |
| The entity no longer exists | The device was removed or the entity was renamed, but its statistics remain. | Confirm the data is no longer needed before deleting it. |
2. Correct a value for a specific hour
This tool can correct an isolated, invalid reading. For example, a meter might jump to 999999 kWh and flatten the rest of the month’s Energy chart. See Chapter 17 for energy statistics.
Home Assistant’s documentation instructs you to select the icon beside the entity, locate the data point with the date and time fields, and edit its value.
-
Find the affected time on the Energy or History chart
Point to the implausible bar and note its date and hour.
-
Go to Settings → Tools → Statistics and find the entity
Use the search box to find the entity by name.
-
Open the adjustment tool and locate the record by date and time
It displays the value recorded for that hour.
-
Enter a reasonable value, save it, and review the chart
You may need to refresh the page before the chart reflects the change.
Use include and exclude to streamline Recorder data
An oversized database is usually caused by high-frequency entities you never review, not by ordinary lights. Start by telling Recorder not to store unnecessary data.
Write these settings in configuration.yaml, run a configuration check, and restart Home Assistant for them to take effect.
Method A: Exclude selected data (recommended for beginners)
Record everything by default, then exclude only known noisy data. This approach reduces the chance of omitting important history.
recorder:
  purge_keep_days: 10
  exclude:
    domains:
      - automation
      - update
    entity_globs:
      - sensor.sun*
      - weather.*
    entities:
      - sensor.date
      - sensor.last_boot
    event_types:
      - my_custom_event
Method B: Include selected data (for tightly controlled databases)
This reverses the default: Recorder stores only the data you name. It offers the most control, but can easily omit history you later need.
recorder:
  include:
    domains:
      - sensor
      - switch
      - media_player
  exclude:
    entities:
      - sensor.last_boot
      - sensor.date
    entity_globs:
      - sensor.weather_*
You can combine the two: use include for a broad set, then exclude for exceptions. The Home Assistant documentation gives the complete precedence rules. As a general guide, more specific rules take priority: explicit entities outrank globs, and globs outrank domains.
Four filter types
| Filter | Scope | Example |
|---|---|---|
domains |
Entire domain | - automation |
entities |
A specific entity | - sensor.last_boot |
entity_globs |
Wildcard patterns for groups of entities | - sensor.phone_* |
event_types |
An event type, not an entity | - call_service |
Common sources of excessive writes
| Type | Why it is noisy | Recommendation |
|---|---|---|
| Mobile-app battery, location, and step sensors | They can change frequently and may have little historical value | Consider excluding sensors you do not review |
| Power sensors reporting every second | One entity can occupy most of the database | Keep only when needed, or purge its detailed history after a few days |
update domain (firmware update notices) |
Little historical value | Recommended to exclude |
| Sun azimuth, weather forecast details | Changes continuously and is rarely useful in History | Recommended to exclude |
| The automation entity’s own state | Activity is the better place to confirm whether an automation ran | Can be excluded |
| Contact, occupancy, light, and lock entities | They change infrequently and can be valuable during investigations | Generally retain |
recorder.purge with apply_filter enabled, as described next.Purge stored data safely
Filtering reduces future growth but does not shrink existing data. Recorder provides these actions (formerly called services):
| Action | Purpose |
|---|---|
recorder.purge |
Delete data older than the specified retention period |
recorder.purge_entities |
Delete data only for specified entities, domains, or globs |
recorder.disable |
Pause recording |
recorder.enable |
Resume recording |
recorder.get_statistics |
Retrieve long-term statistics |
The three recorder.purge parameters
| Parameter | Default | Meaning |
|---|---|---|
keep_days |
Recorder configuration value | Number of recent days to retain |
repack |
false |
Rewrite the database so that storage space is returned to the operating system |
apply_filter |
false |
Apply the configured include and exclude rules to existing data |
After adding exclusion rules and restarting Home Assistant, this combination removes old rows that now match the filters and repacks the database:
action: recorder.purge
data:
  keep_days: 7
  repack: true
  apply_filter: true
Open Settings → Tools → Actions, select recorder.purge, switch to YAML mode, paste the example, and run it. In older versions, this area was named Developer tools and appeared in the sidebar.
repack is resource intensive. Home Assistant may slow down, and the process temporarily requires additional disk space. The documentation recommends free space at least equal to the database size. If storage is nearly full, remove unneeded backups or other files before repacking.Purge only one noisy entity
If one power sensor is causing the growth, do not purge unrelated history. recorder.purge_entities accepts entity_id, domains, or entity_globs. Its keep_days default is 0, which deletes all matching data.
The Home Assistant documentation provides a useful automation example that retains only the most recent 5 days of detailed data for this power sensor:
alias: Clear old data from noisy power sensors every day
triggers:
  - trigger: time
    at: "04:15:00"
actions:
  - action: recorder.purge_entities
    data:
      keep_days: 5
      entity_id: sensor.power_sensor_0
mode: single
This preserves the recent detailed curve without allowing it to grow indefinitely. Long-term statistics are unaffected, so annual trends remain available if the sensor has a supported state class.
The default auto_purge runs at 04:12 each morning, so manual purging is normally unnecessary. Use it after changing filters when you need them applied to old data, or when urgent database cleanup is required.
Database backups and corruption recovery
Full backups include the database
Because home-assistant_v2.db is in the configuration folder, a full backup normally includes it. A large database therefore makes every full backup larger. A 2 GB database included in three retained backups can consume about 6 GB before accounting for other backup content or compression.
To reclaim storage, purge unneeded database rows, filter unnecessary Recorder data, and reduce purge_keep_days if appropriate. Also set backup-retention limits and keep an independent copy outside the Home Assistant host.
Use this order: configure exclusions → restart Home Assistant → run recorder.purge with repack → create a new backup.
Changing databases does not migrate existing history
Symptoms of database corruption and how to respond
Common causes of SQLite corruption include a power failure during a write and failing storage. Home Assistant may still open, while History and Activity are empty and the logs contain database errors.
-
Confirm the diagnosis
Open Settings → System → Logs and look for errors containing
sqliteordatabase. -
Understand Home Assistant’s automatic recovery
If SQLite is irreparably damaged, Home Assistant moves the damaged database aside and creates a new one. Your settings, automations, and devices remain intact; the unavailable data is history.
-
Make sure there is enough disk space
Home Assistant recommends free space of about 2.5 times the database size when recovering a damaged SQLite database. Recovery may fail without enough space.
-
Address the history loss and its root cause
Follow the linked SQLite recovery guidance if the history is important. Otherwise, preserve the damaged
.dbfile for later analysis, allow Home Assistant to start a new database, and address the cause: failing storage or unsafe power removal.
Advanced 1: Switch from SQLite to MariaDB
SQLite is a simple, zero-configuration, single-file database. With many entities and frequent writes, a database server may offer better performance.
Home Assistant documents the following minimum supported versions:
| Database | Minimum version | Best suited to |
|---|---|---|
| SQLite | 3.40.1 | The default; sufficient for most installations |
| MariaDB | 10.3 | A common database-server upgrade on the same host |
| MySQL | 8.0 | Installations that already have a MySQL server |
| PostgreSQL | 12 | Installations that standardize on PostgreSQL |
On Home Assistant OS, install the MariaDB App from the Home Assistant repository under Settings → Apps. Home Assistant 2026.2 renamed Add-ons to Apps, so older instructions may say “Add-on store.” Apps are available only on Home Assistant OS. After installation, add this to configuration.yaml:
recorder:
  db_url: mysql://homeassistant:YOUR_PASSWORD@core-mariadb/homeassistant?charset=utf8mb4
  purge_keep_days: 14
core-mariadb is the App’s hostname on the internal network. The username, password, and database name must match the App configuration. For a database on another host, use the documented URL format:
mysql://user:password@SERVER_IP/DB_NAME?charset=utf8mb4
postgresql://user:password@SERVER_IP/DB_NAMEconfiguration.yaml is plain text and is included in a full backup. Store the URL in secrets.yaml as mariadb_url: mysql://homeassistant:YOUR_PASSWORD@core-mariadb/homeassistant?charset=utf8mb4, then use db_url: !secret mariadb_url in the configuration. secrets.yaml is also sensitive and included in backups; this prevents accidental disclosure when sharing configuration snippets, not disclosure from a leaked backup.purge_keep_days still controls detailed history. For several years of high-resolution time-series data, consider the InfluxDB approach in the next section.Advanced 2: InfluxDB and Grafana for long-term data
This architecture separates control, time-series storage, and visualization:
| Role | Responsibility | Metaphor |
|---|---|---|
| Home Assistant | Controls the home and generates data | Command center |
| InfluxDB | Stores time-series data for long-term analysis | Data warehouse |
| Grafana | Visualizes stored data in dashboards | Showroom |
The official InfluxDB integration writes an additional copy of selected state data to InfluxDB. Local Recorder continues to run independently. You can therefore keep 7 days of detailed Recorder history while applying a separate 3-year retention policy in InfluxDB.
Key configuration points:
- InfluxDB 1.x uses a host URL, username, password, and database name. Authentication is optional and disabled by default.
- InfluxDB 2.x and 3.x use an organization, bucket, and access token. Authentication is required, and
api_version: 2selects the newer API. The integration documentation covers 1.x, 2.x, and 3.x. - For every version, configure filters. The integration supports include and exclude rules for
domains,entities, andentity_globs. Sending every entity to InfluxDB merely moves uncontrolled growth to another database.
InfluxDB and Grafana are available as community-maintained Apps from the hassio-addons Home Assistant Community Apps repository; they are not official Home Assistant Apps. Add that repository before installation, as described in Chapter 20 and Appendix A. Apps are available only on Home Assistant OS; Container and Core installations require separate InfluxDB and Grafana deployments.
Advanced 3: Turn a SQL query into a sensor
The SQL integration turns the result of a SQL query into an entity that you can display on a dashboard or use to trigger an automation. You can add it through the UI configuration flow or YAML.
A classic use is to expose database size as a sensor and monitor it directly on a dashboard.
-
Settings → Devices & services → Add integration
Select the button in the lower-right corner and search for SQL.
-
Leave the database URL blank
db_urlis optional. Leave it blank to query the database currently used by Recorder. -
Paste the query statement
For SQLite, Home Assistant provides this example query:
SELECT ROUND(page_count * page_size / 1024 / 1024, 1) as size FROM pragma_page_count(), pragma_page_size(); -
Enter size as the result column
Enter size, matching
as sizein the query. The query must return only one row. -
Set the name and unit
Name the entity “Database size” and set its unit to MiB. You can also set the device class to Data size so that the interface converts units automatically.
Add the resulting sensor to a dashboard as described in Chapter 6. You can also notify yourself when it exceeds a chosen threshold; see Chapter 7.
alias: Notify me if the database is too big
triggers:
  - trigger: numeric_state
    entity_id: sensor.database_size
    above: 2000
    for: "01:00:00"
conditions: []
actions:
  - action: notify.persistent_notification
    data:
      title: Database warning
      message: The database has exceeded 2000 MiB (approximately 2 GB), it's time to find out who is spamming it.
mode: single
notify.persistent_notification creates a persistent notification in the Home Assistant interface and requires no prior setup, making it suitable for testing. To notify a phone, use the action configured in Chapter 7. for: "01:00:00" requires the value to remain above the threshold for one hour, reducing alerts caused by brief fluctuations.
SELECT queries. Never enter DELETE, UPDATE, or DROP. Delete Recorder data only through recorder.purge or recorder.purge_entities.Common problems
-
Home Assistant responds very slowly
Check Settings → System → Storage for free space, then view the estimated database size in Repairs. If the database is several GB, identify high-frequency sources, add appropriate
excluderules, restart, then runrecorder.purgewithrepack: trueandapply_filter: true. Confirm adequate free space before repacking. -
The memory card has failed and the system will not start
Recorder writes at each
commit_interval, and sustained database growth places a heavy write load on consumer microSD cards. There is no universal lifespan figure. Reduce unnecessary writes by increasingcommit_intervalcautiously and excluding noisy entities; for long-term reliability, migrate the installation to suitable SSD or high-endurance storage. -
All history disappeared after a restart
Check the logs. A damaged database may have been moved aside while Home Assistant created a new one; database errors will identify this case. Alternatively, you may have switched from SQLite to MariaDB. Existing-history migration is not officially supported, so a new database begins empty by design.
-
An entity is completely absent from History
Check whether an
excluderule removed it or anincluderule omitted it. Then confirm that the entity is enabled as described in Chapter 11. If it appears in History but not Activity, that can be normal because Activity omits sensors with units by default. -
Cleanup finished, but free disk space did not increase
This is normal. Purging rows does not immediately return space to the operating system.
repackrewrites the database to reclaim that space. The defaultauto_repackruns every second Sunday; if space is urgently needed and sufficient working space is available, run a purge withrepack: true. -
An extreme value flattened the Energy chart
Open Settings → Tools → Statistics, locate the entity and timestamp, and correct the invalid value. Make a backup first and follow the detailed procedure in this chapter’s Tools → Statistics section.
-
The downloaded CSV contains garbled text
Do not open the file by double-clicking it. In Excel, use Data → From Text/CSV and select UTF-8. In Google Sheets, use File → Import; it usually detects the encoding automatically.
-
A Recorder action is missing or does not run
Use Settings → Tools → Actions, not Developer tools in the sidebar; that location was removed in 2026.2. Recorder actions also require Administrator privileges. Switch from a standard account to an Administrator account and try again.
FAQ
Will setting purge_keep_days to 365 preserve all history permanently?
Use long-term statistics for eligible numeric data, and send selected high-resolution data to a dedicated time-series database when required. Set
purge_keep_days according to how much detailed recent history you actually need; 7 to 14 days is sufficient for most installations.Why does my temperature curve three months ago look smooth and different from what I saw then?
This is an intentional storage trade-off. If you require minute-level data after the Recorder retention period, configure suitable external time-series storage before that data is generated.
I added an entity to exclude. Why is its old data still there?
Run
recorder.purge with apply_filter: true to apply the configured filters to existing data, or run recorder.purge_entities for a specific entity_id. Its default keep_days value is 0, which immediately deletes all matching data.After editing the configuration, restart Home Assistant before using
apply_filter so that the new filtering rules are active.Will my existing history move with me when I switch to MariaDB?
If you intend to switch, do it early. Before changing a mature installation, export important History data to CSV and preserve a tested backup. Treat the new database as a fresh history baseline.
What is the fastest way to export one sensor’s data to Excel?
Start with a one-day range to inspect the file before exporting more data. Beyond the 10-day default detailed-history window, eligible sensors export hourly statistics rather than individual state changes. Use recent days for fine-grained changes and a longer range for trends.
Are my backups growing because of the database, and can I exclude history?
The built-in backup interface can include or exclude media, shared folders, and other items, but database-specific options vary by version. Follow the choices shown in your installation.
Regardless of those options, the most effective approach is to reduce the database first so that subsequent backups are smaller. Configure exclusions → restart → purge with repack → create a new backup.
Can I remove History and Activity from the sidebar if I do not use them?
Edit mode can organize only items already in the sidebar. It cannot restore Tools, moved under Settings in 2026.2, to the sidebar; Home Assistant says fuller sidebar customization is still planned.
Hiding an item does not stop Recorder. The same data continues to be stored, so hiding History or Activity does not save space. Use the include, exclude, and purge controls described in this chapter instead.
How do I know which entity is flooding the database?
For exact counts, community SQL queries can tally rows by entity. Database schemas change, however, so old queries found online may no longer work. When in doubt, visually checking update density in History remains a reliable starting point.