Life logging and custom dashboards
Use helpers to record habits, household spending, meter readings, maintenance, and family notes that sensors cannot capture automatically. Then turn those records into useful charts and a dashboard you will actually use.
Why create your own records?
Once you have a smart home, you notice an odd gap: sensors can record temperature, humidity, battery levels, and whether a door is open, yet many of the things that matter in daily life have no sensor.
- Was the balcony air purifier’s filter last replaced in March or April? No one remembers.
- How much have water, electricity, and gas cost this month? You may not know until the bills arrive, when it is too late to adjust.
- How long has it been since the aquarium water was changed? Relying on memory often means noticing only when the water turns cloudy.
- A family member leaves “Do not run the dishwasher today” on the refrigerator, but you never enter the kitchen.
These situations have one thing in common: the information is in someone’s memory, not in a system. Put it into Home Assistant and you can retain a timeline, create charts, and receive reminders when something is due.
By the end of this chapter, you will be able to:
-
Turn anything into a recordable entity
Match numbers, text, options, dates, and counts to the appropriate helper for each recording need.
-
Let the record draw itself into a chart
Understand why some values support long-term trend charts while others do not, and learn how to bridge the gap.
-
Process raw numbers into meaningful metrics
Use Utility Meter to calculate monthly usage automatically, and use Template sensors to calculate the days since the last maintenance.
-
Create a really useful dashboard
Use the Sections layout and conditional cards to tailor what phones and tablets display.
Five helpers and what each one records
Create helpers under Settings → Devices & services → Helpers, then select Create helper in the lower-right corner. The following five types are the most useful for record keeping.
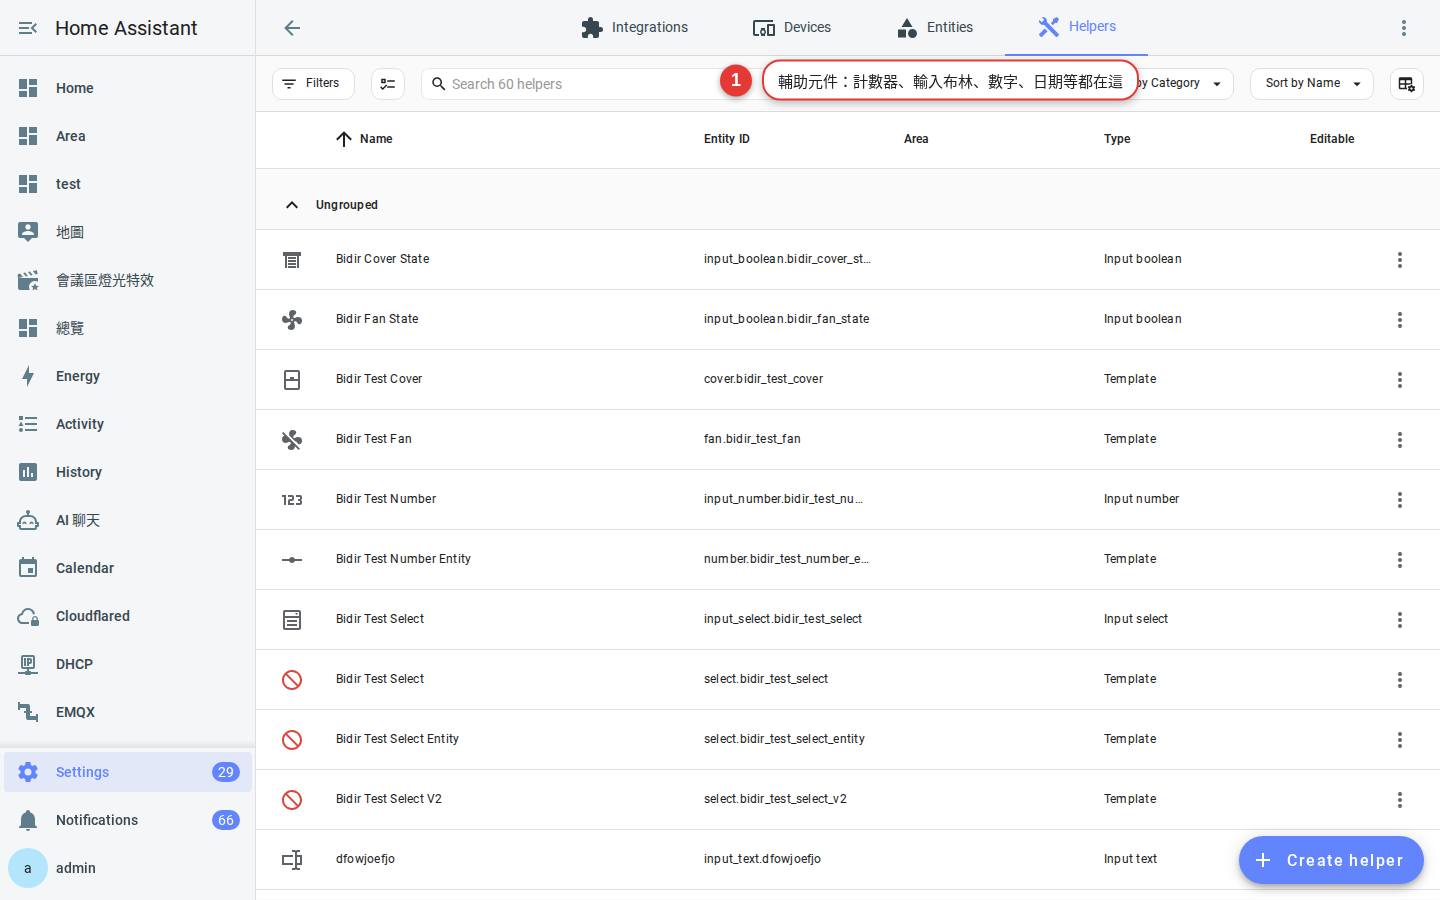
| Helper type | Entity prefix | What it stores | Household examples |
|---|---|---|---|
| Number | input_number. | An adjustable numeric value | Weight, total spending this month, room target temperature |
| Text | input_text. | A short piece of text | Household message, parking-space number, delivery instructions |
| Dropdown | input_select. | One choice from a fixed set | Who takes out the trash today, washing-machine mode, household status |
| Date and/or time | input_datetime. | A date, a time, or both | Last filter-replacement date, next payment date |
| Counter | counter. | An integer changed in fixed steps | Glasses of water today, workouts this week, litter-box cleanings |
What is the difference between a Number and a Counter?
Both hold numbers, but they suit different kinds of input:
Numbers input_number | Counter counter | |
|---|---|---|
| Input method | Drag a slider or type a value (mode can be slider or box) | Increment, decrement, reset, or set directly |
| Decimals? | Yes; the minimum step is 0.001 | Primarily integers; the step defaults to 1 |
| Reset action? | No; set the value back to 0 yourself | Yes; counter.reset returns it to its initial value |
| Best for | Specific values, such as a weight of 62.4 or a meter reading of 1284 | Counts that change one step at a time, such as 1 glass of water or 1 workout |
Actions you will use
Use this table as a quick reference when writing automations or scripts. Older documentation called these “Services”; they are now called “Actions,” and the YAML key has changed from service: to action:.
| Action | Purpose | Required data |
|---|---|---|
input_number.set_value | Set value directly | value |
input_number.increment / decrement | Add or subtract one configured step | None |
counter.increment / decrement | Add or subtract one step | None |
counter.reset | Return to the initial value | None |
counter.set_value | Set a specific value | value |
input_text.set_value | Store text | value |
input_select.select_option | Choose an option | option |
input_select.select_next / select_previous | Select the next or previous option | None |
input_datetime.set_datetime | Set a date or time | date and/or time; alternatively, use datetime or timestamp, neither of which can be combined with the other fields |
input_text; the “Notes and lists” section presents a safer alternative. Helper states may be visible in dashboards and history and may be included in backups, so never use them for passwords, access tokens, payment-card details, or other secrets.Hands-on: Track today’s water in five minutes
Start with a simple example: add a dashboard control that records each glass of water and resets the count at midnight.
-
Create a Counter
Go to Settings → Devices & services → Helpers, select Create helper, and choose Counter. Name it “Water today,” set the icon to
mdi:cup-water, the minimum to 0, and the step to 1. Leave the remaining settings at their defaults, then select Create. -
Confirm its entity ID
Open the new helper and check its entity ID. If the generated ID is unclear, change it to a readable value such as
counter.water_cups_today. Chapter 4 explains naming rules and the implications of changing an ID. -
Add it to the dashboard and enable its controls
Return to the dashboard, select Edit in the upper-right corner, and then select Add card. Search for “Water today” and choose a Tile card. One detail often causes confusion: a Tile card displays only the number by default; it does not include increment or decrement buttons. In the card editor, scroll to Features, add Counter actions, and choose the controls to display: increment, decrement, and reset. Save the card to make the controls appear.
-
Create an automation that resets the counter at midnight
Go to Settings → Automations & scenes → Create automation, switch to YAML mode, and paste the following configuration. If the trigger-condition-action structure is unfamiliar, review Chapter 8.
-
Test
In the automation editor, select Run and confirm that the counter returns to 0. If it does, the complete workflow is working.
alias: Reset daily water count at midnight
triggers:
  - trigger: time
    at: "00:00:00"
conditions: []
actions:
  - action: counter.reset
    target:
      entity_id: counter.water_cups_today
mode: single
In YAML mode, the Tile card looks like this. To add more counters later, copy it and change the entity:
type: tile
entity: counter.water_cups_today
name: Water today
features:
  - type: counter-actions
    actions:
      - increment
      - decrement
- resettype: numeric-input). Set style to slider for a slider or buttons for increment and decrement buttons. For values such as weight or spending, direct entry is usually faster than opening the entity dialog each time.counter.reset, use input_number.set_value to copy the value into a separate Number helper for yesterday’s water.Example 1: Everyday habit tracking
How the three helpers divide the work
| What to record | Helper type | Key settings |
|---|---|---|
| Glasses of water | Counter | Minimum 0, step 1, reset every day at midnight |
| Workouts | Counter | Minimum 0, step 1, reset every Monday morning |
| Weight | Number | Minimum 30, maximum 150, step 0.1, unit kg, Input box mode |
For weight, use an input box rather than a slider. Dragging a slider precisely to 62.4 is awkward; typing the value is much faster. Under Display mode, choose Input box. The kilogram range shown here is only an example; use the unit and range appropriate to your measurement system.
Reset the workout count every Monday
alias: Reset the workout count every Monday
triggers:
  - trigger: time
    at: "05:00:00"
conditions:
  - condition: time
    weekday:
      - mon
actions:
  - action: counter.reset
    target:
      entity_id: counter.workout_count
mode: single
Arrange it on the dashboard
Place three cards in one section: two Tile cards for water and workouts, plus a Gauge card for today’s water count. A Gauge’s min defaults to 0 and its max defaults to 100, so adjust the range to suit your use.
type: gauge
entity: counter.water_cups_today
name: Water today
unit: glasses
min: 0
max: 8
needle: true
segments:
  - from: 0
    color: var(--error-color)
  - from: 3
    color: var(--warning-color)
  - from: 6
color: var(--success-color)segments colors take effect only when needle: true. With the needle disabled, configured segment colors are not displayed.Want to see long-term trends? Read the next step first
To chart a value over three months, account for this limitation: the helper does not produce long-term statistics. Adding input_number.weight directly to a Statistics graph card therefore reports that statistics are unavailable. The “Derived values” section shows the required sensor pattern.
Example 2: Household spending and meter readings
A. Record an expense as it occurs
Use two Number helpers and one script: one helper stores the new entry, the other stores the monthly total, and the script adds the entry to the total.
-
Create three Number helpers
Create
input_number.expense_entryfor one expense andinput_number.expense_month_totalfor the running monthly total. Choose a maximum appropriate to your currency instead of treating 100000 as universal, and choose a step of 1 or the smallest denomination you plan to enter. Use Input box mode. In these examples,local currencymeans the currency code or symbol you use. A code such as USD or EUR is unambiguous; a symbol such as $ or € is shorter but may be shared by several currencies. Also createinput_number.expense_last_monthwith the same settings as the total. The third helper is used by the monthly close-out automation below. -
Create a script that adds the entry
Go to Settings → Automations & scenes → Scripts, create a script, switch to YAML mode, and paste the following configuration. Chapter 10 explains script fields and execution modes.
-
Add the script to a dashboard card
Add an Entities card to the dashboard and place both Number helpers and the script on it. Enter a value, run the script, confirm that the total increases, and check that the entry resets.
-
Close out the total automatically on the first of each month
The following automation first copies the current month’s total to “last month,” then resets the current total to zero. Scheduled times follow the time zone configured in Home Assistant.
alias: Record an expense
sequence:
  - action: input_number.set_value
    target:
      entity_id: input_number.expense_month_total
    data:
      value: >-
        {{ states('input_number.expense_month_total') | float(0)
           + states('input_number.expense_entry') | float(0) }}
  - action: input_number.set_value
    target:
      entity_id: input_number.expense_entry
    data:
      value: 0
mode: single
alias: Close out expenses on the first of each month
triggers:
- trigger: time
at: "00:05:00"
conditions:
- condition: template
value_template: "{{ now().day == 1 }}"
actions:
- action: input_number.set_value
target:
entity_id: input_number.expense_last_month
data:
value: "{{ states('input_number.expense_month_total') | float(0) }}"
- action: input_number.set_value
target:
entity_id: input_number.expense_month_total
data:
value: 0
mode: singlechoose in the script to select the appropriate total. Keep the system manageable by limiting it to four or five categories.B. Enter water, electricity, and gas meter readings manually
If your utility provider does not expose readings digitally, enter each meter’s cumulative reading in a Number helper and let Home Assistant calculate usage for each billing period.
| Helper | Purpose | Settings |
|---|---|---|
input_number.meter_electricity | Current cumulative electricity-meter reading | Use a high maximum, such as 999999; step 1; unit kWh |
input_number.meter_water | Current cumulative water-meter reading | Unit m³ |
input_datetime.meter_read_date | Date of this meter reading | Enable Date only |
If you already have a smart meter, energy sensor, or smart plug that reports energy, skip manual entry and use that sensor as the Utility Meter source.
Example 3: Device maintenance records and automatic reminders
These tasks all follow the same pattern: record the most recent date → calculate the elapsed days → send a reminder when the interval is exceeded. Once configured, the pattern works for filters, aquarium water changes, air-conditioner cleaning, toothbrush-head replacement, and more.
-
Create a Date helper
Go to Settings → Devices & services → Helpers → Create helper → Date and/or time. Name it “Filter last changed,” enable Date only, and leave Time disabled. Use the entity ID
input_datetime.filter_last_change. -
Create a Template sensor that counts days
Go to Settings → Devices & services → Helpers, select Create helper, choose Template, then Sensor. Name it “Days since filter change,” paste the template below into the state template, and set the unit of measurement to
days. After creating it, change the entity ID tosensor.filter_days_sincefor the later automation. -
Create a “Changed today” button
Create a script that sets the helper to today’s date. After replacing the filter, one press records the change without opening a calendar.
-
Automate reminders
The automation checks every day at 9 a.m. and sends a notification once 90 days have elapsed. See Chapter 7 for notification setup.
{{ ((now().timestamp()
     - as_timestamp(states('input_datetime.filter_last_change'), 0))
/ 86400) | int(0) }}| int(0) discards the fractional part and counts complete days. A filter changed this morning therefore remains at 0 days until a full day has passed. Using round(0) could show 1 day after only half a day. The 0 in parentheses is the fallback when no date is set or the entity is temporarily unavailable, preventing an unknown result.alias: The filter has been replaced
sequence:
- action: input_datetime.set_datetime
target:
entity_id: input_datetime.filter_last_change
data:
date: "{{ now().strftime('%Y-%m-%d') }}"
mode: singlealias: Filter replacement reminder
triggers:
- trigger: time
at: "09:00:00"
conditions:
- condition: numeric_state
entity_id: sensor.filter_days_since
above: 89
actions:
- action: notify.persistent_notification
data:
title: Living-room air purifier
message: >-
The filter has been in use for {{ states('sensor.filter_days_since') }} days. It is time to replace it.
mode: singlenumeric_state trigger and action branches. The second approach takes more setup but is easier to understand when starting out.A Markdown card provides a simple at-a-glance maintenance summary. Its content field accepts templates directly:
type: markdown
title: Maintenance status
content: |-
  | Item | Elapsed | Interval |
  |---|---|---|
  | Air-purifier filter | {{ states('sensor.filter_days_since') }} days | 90 days |
  | Aquarium water change | {{ states('sensor.tank_days_since') }} days | 14 days |
  | AC cleaning | {{ states('sensor.ac_days_since') }} days | 180 days |
Example 4: Notes and a household message board
Text helpers for short messages
A Text helper is enough for a short message such as “Do not run the dishwasher today.” Its maximum length defaults to 100 and can be increased to 255, the hard limit for a Home Assistant entity state. Add the helper to an Entities card so you can edit it directly from the dashboard.
Add a Date and/or time helper to record when the message was changed, using an automation like this:
alias: Record when the message changes
triggers:
  - trigger: state
    entity_id: input_text.family_message
conditions: []
actions:
  - action: input_datetime.set_datetime
    target:
      entity_id: input_datetime.family_message_time
    data:
      datetime: "{{ now().strftime('%Y-%m-%d %H:%M:%S') }}"
mode: single
Use to-do lists, not text fields, for lists
Shopping lists, repair lists, and other changing collections are awkward in a text field, and 255 characters fill up quickly. Home Assistant includes the Local To-do integration. Its data remains on your Home Assistant system and requires no cloud account, but “local” does not mean private from Home Assistant users who can access the list or from anyone who obtains a backup.
-
Add the integration
Go to Settings → Devices & services → Add integration, search for Local to-do, and follow the on-screen instructions to create a list such as “Shopping list.”
-
Create additional lists
You can add multiple lists through the same integration. Start with at least two, such as “Shopping” and “Home repairs.”
-
Add a list to the dashboard
Edit the dashboard, select Add card, find the To-do list card, and choose the list you created. You can add items and mark them complete directly from a phone.
-
Let automation help you add items
Use the
todo.add_itemaction. For example, the filter reminder can both notify you and add “Buy a filter” to the shopping list.
actions:
  - action: todo.add_item
    target:
      entity_id: todo.shopping_list
    data:
      item: Buy a purifier filter
Other available actions include todo.update_item (edit or complete an item), todo.remove_item (delete an item), todo.get_items (retrieve list contents), and todo.remove_completed_items (remove completed items).
input_select.select_next once a day to advance the schedule automatically.Let the record grow into a chart
Four card types cover most recording needs. The key is to know which data each card accepts.
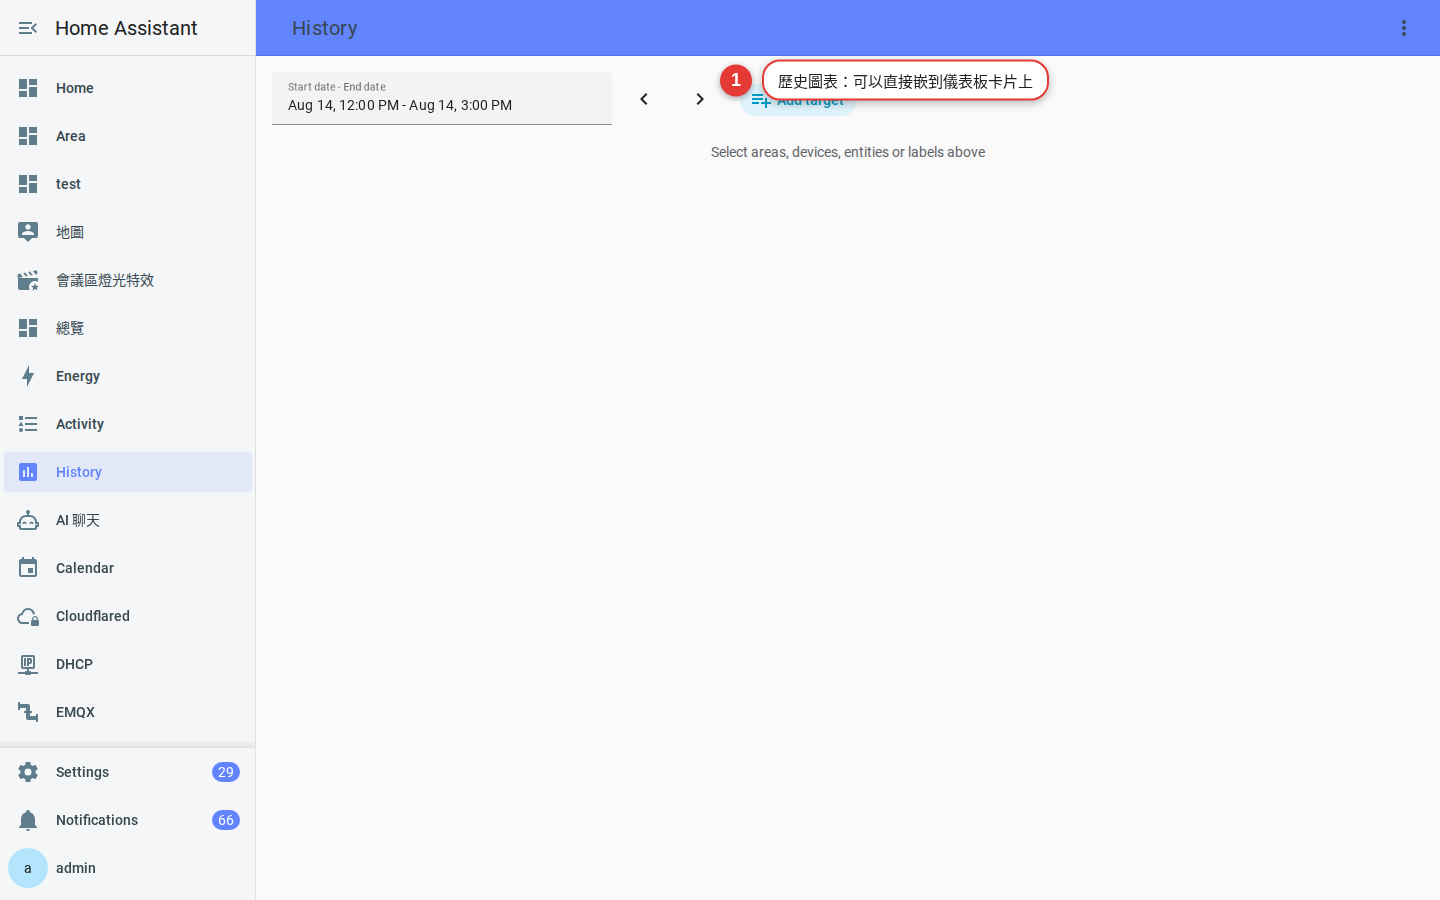
history-graph card can place the same type of graph on a dashboard.| Card | What to see | Source | Common parameters |
|---|---|---|---|
History graph history-graph | Changes over the past few hours or days | Raw states from Recorder | hours_to_show (default 24) |
Statistics graph statistics-graph | Long-term trends over weeks or years | Long-term statistics | days_to_show (default 30), stat_types, chart_type, period |
Gauge gauge | A current value with a sense of progress | Current entity state | min (0), max (100), needle, segments |
Markdown markdown | A custom text summary | Templates drawing from any entity | content, title, text_only |
History graphs: inspect the short term
type: history-graph
title: Water and exercise over the past two days
hours_to_show: 48
entities:
  - entity: counter.water_cups_today
    name: Water
  - entity: counter.workout_count
    name: Exercise
Statistics graphs: inspect the long term
One prerequisite determines whether an entity can appear in a long-term statistics graph:
measurement, total, or total_increasing. Helpers such as input_number and counter have no state class, so adding one directly results in “statistics unavailable.”Use a template sensor to expose the helper’s value with a state class. Although you can create template sensors from the Helpers page, Home Assistant documentation says that the UI offers “a relatively streamlined subset of options” and may not expose every advanced field. The examples here therefore use configuration.yaml for more consistent access to those fields:
template:
  - sensor:
      - name: "Weight record"
        unique_id: weight_record
        unit_of_measurement: "kg"
        device_class: weight
        state_class: measurement
        state: "{{ states('input_number.weight') | float(0) }}"
        availability: "{{ is_number(states('input_number.weight')) }}"
Save the file, open Tools → YAML from the sidebar, and reload Template entities. The new entity will then appear as sensor.weight_record. Starting with version 2026.8, “Developer tools” is named “Tools”; older versions use the former name in the same location. Add the new sensor to a Statistics graph card:
type: statistics-graph
title: Weight trend
days_to_show: 90
chart_type: line
period: day
stat_types:
  - mean
entities:
  - entity: sensor.weight_record
name: Weightstat_types include min, max, mean, sum, state, and change; period can be 5minute, hour, day, week, month, year, or auto.period: day, week, or month, the card uses hourly long-term statistics, so the first point may not appear until the next hourly aggregation. To see data sooner, use a History graph or set period to 5minute for short-term statistics.Markdown: turn several values into a readable summary
type: markdown
title: This month’s summary
content: |-
  ### This month so far

  - Total spending **{{ states('input_number.expense_month_total') | int(0) }}** in local currency
  - Same period last month: {{ states('input_number.expense_last_month') | int(0) }} in local currency
  - Electricity meter: {{ states('input_number.meter_electricity') }} kWh
  - Last meter reading: {{ states('input_datetime.meter_read_date') }}
Process raw numbers into meaningful metrics
Raw values, such as cumulative meter readings or individual weight entries, are not always meaningful on their own. Home Assistant provides several helpers that derive useful metrics without requiring a custom program.
| Helper | What it calculates | Household use |
|---|---|---|
| Utility Meter | Splits a continuously increasing sensor into daily, monthly, or yearly usage | Electricity used this month or water used this billing period |
| Statistics | Calculates a sensor’s mean, maximum, minimum, change, sample count, and more | Average weight over the past 30 days |
| Derivative | Calculates change per hour or day | Rate of energy use or water-level decline |
| Template | Evaluates a formula that you define | Days since maintenance or an estimated utility cost |
Utility Meter: calculate monthly usage automatically
Utility Meter needs a sensor whose value continually increases as its source. For manual readings, use a Template sensor to expose the input_number value with the total_increasing state class:
template:
  - sensor:
      - name: "Cumulative meter reading"
        unique_id: meter_electricity_total
        unit_of_measurement: "kWh"
        device_class: energy
        state_class: total_increasing
        state: "{{ states('input_number.meter_electricity') | float(0) }}"
Then go to Settings → Devices & services → Helpers → Create helper → Utility Meter and configure these fields:
| Field | Value |
|---|---|
| Input sensor | sensor.meter_electricity_total |
| Meter reset cycle | Every 15 minutes, hourly, daily, weekly, monthly, every two months, quarterly, or yearly |
| Periodically resetting | Enabled by default. Leave this on only if the source itself resets to 0, as some smart plugs do after losing power. Manual readings and physical utility meters do not reset, so turn this option off for them or usage will be calculated incorrectly. |
| Delta values | Enable only when each source value reports the latest increment rather than a cumulative total. |
| Net consumption | Enable only when the value can be positive or negative, such as a solar system that exports energy. |
| Tariffs | Configure only for time-of-use rates. Doing so creates an additional Select entity for switching tariffs. |
After creation, you will have an additional sensor such as “Monthly energy” (the exact name depends on your configuration). Add it to a Tile card to display the kilowatt-hours used so far this month. The Utility Meter resets at the start of the next month.
For a bar chart of monthly usage, add the continuously increasing source sensor to a Statistics graph card and use change to calculate each month’s consumption:
type: statistics-graph
title: Monthly energy use
days_to_show: 365
chart_type: bar
period: month
stat_types:
  - change
entities:
  - sensor.meter_electricity_total
For a manual reset or correction, use utility_meter.reset to reset the meter to zero or utility_meter.calibrate to set a specified value.
Statistics helper: average
From the Helpers page, create a Statistics helper and select the required characteristic. Numeric sensors support the mean, median, sum, change, sample count, maximum, minimum, and other characteristics.
Custom dashboards: arrange records to suit your needs
With the data in place, the next step is presentation. New dashboard views default to the Sections layout, which is well suited to this purpose.
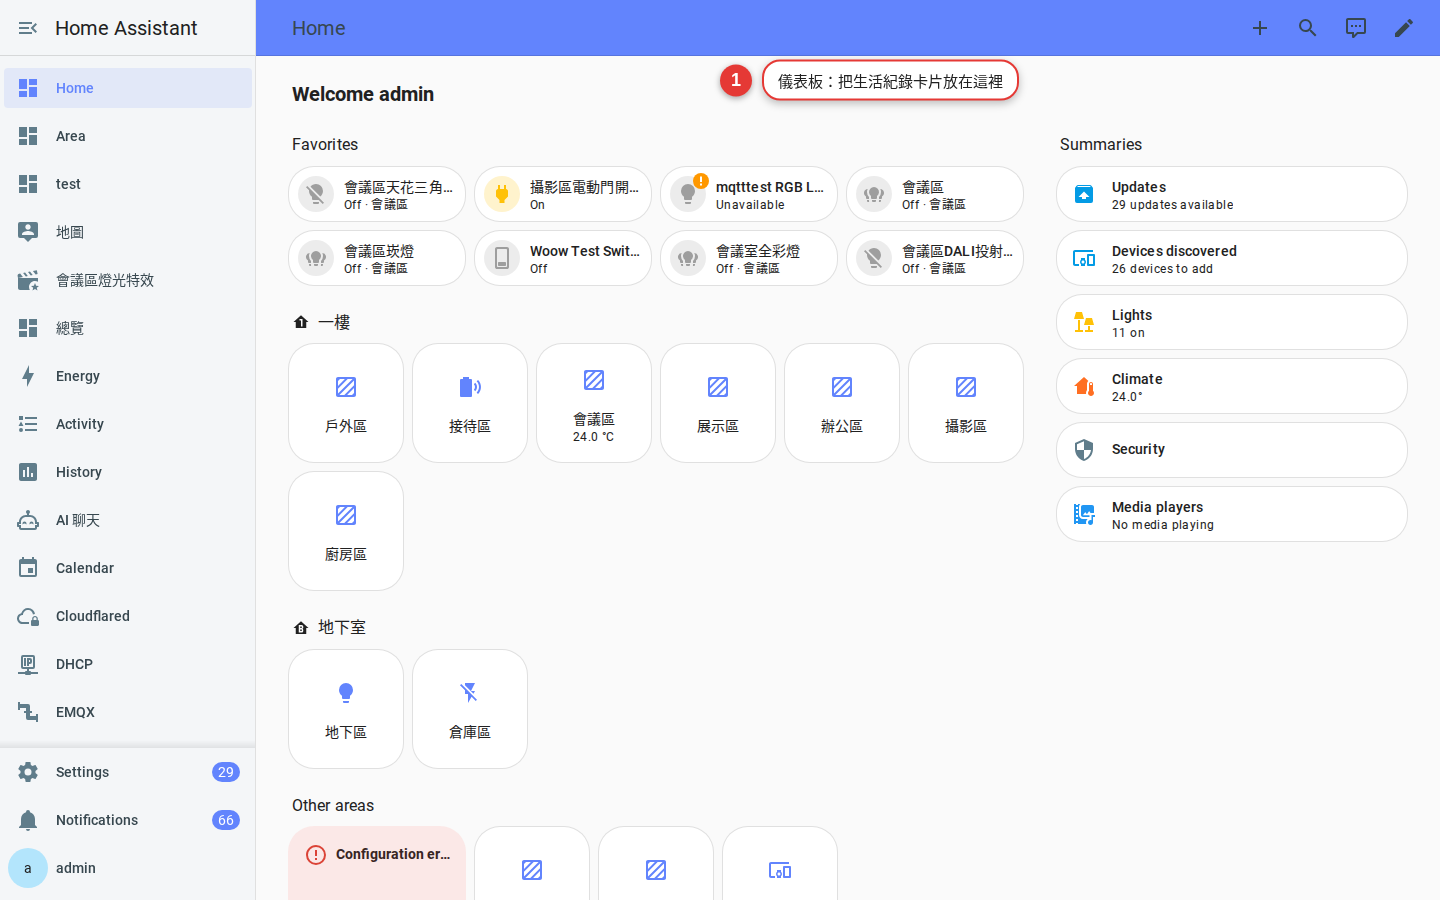
How to think about the Sections layout
Think of it as a noticeboard: the view is a grid containing sections, and each section contains cards. Unlike the older Masonry layout, you do not need vertical-stack cards to force cards into groups; each section is already a grouping unit.
| Setting | Location | Purpose |
|---|---|---|
| Max columns | View settings | Limits the number of columns on wide screens; 3 or 4 usually works well |
| Dense section placement | View settings | Fills gaps automatically, producing a denser layout with less manual placement control |
| Heading card | Top of each section | Labels the section; heading_style can be title or subtitle, and the card can include badges |
| Badges | Top of the view or on a Heading card | Show an entity value compactly, such as “Water today: 5 glasses” |
A suggested layout for a “Life log” view
-
Add new view
In the dashboard’s upper-right corner, select Edit, then select + at the right end of the tab bar. Choose the Sections view type, use “Life log” as the title, and set the maximum number of columns to 3.
-
First section: “Today”
Add a Heading card titled “Today,” followed by a water Counter tile, a workout Counter tile, and a water Gauge. Place this frequently used section at the top.
-
Second section: “This month”
Add a Heading card titled “This month,” followed by the Entities card for monthly spending, the expense-entry script button, and the monthly energy Statistics graph.
-
Third section: “Maintenance and to-do”
Add the maintenance-status Markdown card, the shopping To-do list card, and the household-message Entities card.
-
Fourth section: “Trends”
Add the weight chart and other long-term Statistics graphs. Because this section needs less frequent attention, place it at the bottom.
type: heading
heading: Today
icon: mdi:calendar-today
heading_style: title
badges:
  - type: entity
    entity: counter.water_cups_today
  - type: entity
    entity: counter.workout_count
Conditional cards: hide what is not currently relevant
A Conditional card disappears when its conditions are not met. Supported condition types include state, numeric_state, screen, user, location, and time; combine them with and, or, and not.
type: conditional
conditions:
  - condition: numeric_state
    entity: sensor.filter_days_since
    above: 89
card:
  type: markdown
  content: The filter is more than 90 days old. Remember to replace it.
Phones and tablets see different things
The screen condition accepts a CSS media-query string, allowing detailed charts on large screens and compact alternatives on small screens.
type: conditional
conditions:
  - condition: screen
    media_query: "(min-width: 1024px)"
card:
  type: statistics-graph
  title: Full trend
  days_to_show: 365
  chart_type: line
  entities:
    - sensor.weight_record
type: conditional
conditions:
- condition: screen
media_query: "(max-width: 1023px)"
card:
type: gauge
entity: counter.water_cups_today
name: Water today
min: 0
max: 8The user condition can also show each household member a personal record card. Chapter 5 covers user accounts.
Community cards worth installing
Built-in cards are sufficient for most life-log dashboards, so learn them before adding third-party code. If you need capabilities they do not provide, install community cards through HACS as described in Appendix A. The following cards are commonly used, but their maintenance schedules vary widely: some receive monthly updates, while others may go more than a year without a release. “Common” does not mean “guaranteed to work with your version.”
| Card | Purpose | Use on a life-log dashboard |
|---|---|---|
| Mushroom | A lightweight visual card collection | Arranges counters neatly with touch-friendly controls, especially on phones |
| ApexCharts Card | An advanced chart card | Adds multiple series, custom Y-axes, weekly comparisons, and other controls that built-in charts lack |
| Bubble Card | Mobile-first cards and pop-ups | Moves spending and log-entry controls into pop-ups to keep the main view uncluttered |
| Mini Graph Card | A compact line chart | Shows a small trend without consuming much dashboard space |
| card-mod | Customizes card colors, fonts, and spacing | Adjusts appearance without changing data |
Export and save records
As records accumulate, you may want to analyze them elsewhere or protect them against database failure. Use three layers of protection:
Level 1: Download a CSV
-
Open the History panel
Open History from the sidebar. This is where you graph and download numeric values. The separate Activity panel—called Logbook in older versions—is an event log showing who did what and when. From version 2026.8, Activity has its own CSV download, but use History when exporting numeric measurements.
-
Select entities and a time range
Select the area, device or entity you want, and then set the time range.
-
Download the data
Select Download data in the upper-right corner to create a CSV that you can open in a spreadsheet.
purge_keep_days is 10. For older periods, History and its downloads automatically use hourly long-term statistics, so those values may differ from the raw data. This is an intentional space-saving design, not a bug. A downloaded CSV may contain sensitive household patterns or health and spending records; review it before sharing it and protect any copy stored in a cloud drive.Level 2: Include the database in backups
Home Assistant’s default database is home-assistant_v2.db in the configuration directory, and built-in backups include it. Chapter 9 covers backup settings and restoration. If these records matter, enable a regular automatic backup schedule.
Level 3: Keep a separate copy of important totals
For additional resilience, make the monthly close-out automation write totals to a to-do list or send them in a notification. If the database fails, you will still have a separate written record.
actions:
  - action: todo.add_item
    target:
      entity_id: todo.household_log
    data:
      item: >-
        {{ now().strftime('%Y-%m') }} spending:
{{ states('input_number.expense_month_total') | int(0) }} in local currencypurge_keep_days, understanding that the larger database may strain an SD card or low-capacity drive.Troubleshooting
-
A helper resets to zero after a restart
Number, Text, Dropdown, and Date and/or time helpers normally restore their pre-restart values. Counters also have a
restoreoption, enabled by default. If a YAML-defined helper resets, check forinitial: that value takes precedence over restoration and overwrites the saved state at startup. Removeinitialif you want restoration. An improper shutdown, such as disconnecting power, can also prevent the latest state from being written. -
The statistics graph card says there is no data
The usual cause is adding a helper directly. Helpers have no state class and do not generate long-term statistics. Follow “Let the record grow into a chart” to expose the helper through a Template sensor with
state_class: measurement. If the graph remains empty, wait until after the next hourly aggregation for the first long-term statistic. -
The history chart is empty or has only one straight line
First make sure Recorder has not excluded the entity. A value that never changes correctly appears as a straight line. If the History range exceeds 10 days, the panel switches to long-term statistics; a helper without long-term statistics then appears blank. To inspect the helper’s raw state changes, keep the range within 10 days and use a suitable
hours_to_showvalue on the card. -
Cards are cut off or squished on your phone
Confirm that the view uses Sections, then check whether too many items are packed into one stack. For a long Markdown card, add
card_sizeto reserve enough height. Markdown tables can overflow narrow screens, so use a list rather than a table on mobile layouts. -
The Template sensor exists in YAML but its entity is missing
After changing
configuration.yaml, open Tools (called “Developer tools” before 2026.8) → YAML and reload Template entities. If the entity still does not appear, run Check configuration and inspect the YAML indentation. Also check whetherconfiguration.yamlalready contains atemplate:block. YAML accepts only one effective top-level key of that name, so add the sensor to the existing block rather than creating a duplicate. -
Condition cards never show up
A Conditional card appears only when all conditions are met. For
numeric_state,aboveis strictly greater than:above: 90does not match a value of exactly 90, so useabove: 89here. For ascreencondition, enclose the complete media-query string in quotation marks. -
The script runs but the total does not change
Check whether the calculated result exceeds the
input_numbermaximum; Home Assistant rejects values above that limit. Use a conversion with a fallback, such as| float(0), so a temporarilyunavailableentity does not make the whole template fail.
FAQ
Should I use a Counter or a Number?
counter) with actions such as counter.increment and counter.reset. For a specific value, such as 62.4 kg or a meter reading of 1284, use a Number (input_number) in Input box mode. A Counter’s one-action reset is particularly convenient for daily counts.How can I store a long passage or a shopping list when a Text helper is too short?
todo.add_item. Do not put credentials or other secrets in either kind of entity.How can I show one weekly weight point instead of daily fluctuations?
period to week and stat_types to mean to plot weekly averages. Alternatively, create a Statistics helper with the mean characteristic and a Maximum age of 7 days, then chart that rolling seven-day average sensor. The first approach is simpler.Must a Utility Meter source be a smart meter?
input_number directly. For readings entered by hand, expose the Number helper (input_number) through a Template sensor with state_class: total_increasing, then use that sensor as the Utility Meter input. Turn off Periodically resetting for a physical meter that never resets itself. The option is enabled by default, and leaving it on can produce incorrect usage.How can I avoid scrolling so far to reach these cards on my phone?
screen conditions, and the mobile app sidebar can hide dashboards you rarely use.